Chapter · 02
Data & Methods
The Olist Brazilian e‑commerce dataset — eight relational tables, cleaned, merged, and engineered into an analysis‑ready foundation for classification.
07 · Source
The Olist E‑commerce Dataset
A large‑scale Brazilian retail dataset widely used for machine learning and business analytics research, integrating multiple relational tables that describe the full customer journey from listing to review.
TABLE · 01
Orders
Timestamps for purchase, approval, shipping, delivery, and estimated delivery.
TABLE · 02
Order Items
Links orders to products, sellers, item prices, and freight charges.
TABLE · 03
Products
Category, dimensions, and weight; categories translated from Portuguese.
TABLE · 04
Sellers
Geographic information of sellers — ZIP code prefixes, city, and state.
TABLE · 05
Customers
Customer identifiers and geographic information for distance analysis.
TABLE · 06
Payments
Payment methods, installment counts, and payment values.
TABLE · 07
Reviews
Customer review scores and textual feedback — the target variable.
TABLE · 08
Geolocation
Maps ZIP code prefixes to latitude / longitude for distance modeling.
08.2 · Preprocessing
Cleaning, typing, and merging.
Data cleaning was performed separately for each dataset and followed a structured approach: correcting data types, removing invalid entries, handling missing values, and preparing the tables for merging. Timestamp fields were converted to datetime, numeric fields to proper types, and only valid operational statuses (e.g. delivered, shipped,approved) were retained.
Missing delivery dates were replaced with estimated delivery dates, review comments filled with empty strings, and non‑critical missing rows removed. Numeric product attributes were imputed using median values. All cleaned tables were then merged into a single master table — orders ⇢ customers ⇢ items ⇢ products ⇢ payments ⇢ reviews — via shared identifiers, producing the unified analytical dataset.
08.4 · Feature Engineering
New variables capturing operational, product, and customer signal.
FEATURE · 01
Delivery Delay
actual_delivery_date − estimated_delivery_date
Early, on time, or late.
FEATURE · 02
Delivery Time (Total Days)
actual_delivery_date − purchase_date
Total fulfilment duration.
FEATURE · 03
Price‑to‑Freight Ratio
price / freight_value
Detects disproportionate shipping cost.
FEATURE · 04
Product Volume
length × height × width
Packaging and handling complexity.
FEATURE · 05
Review Sentiment Flags
positive (4–5) · neutral (3) · negative (1–2)
Binary indicators.
FEATURE · 06
Payment Installment Features
n_installments, value_per_installment
Payment behavior.
09 · Exploratory Data Analysis
Reading the dataset before modeling.
EDA was conducted to understand how operational, product, and customer‑related factors influence customer review scores — surfacing patterns that may explain variations in review outcomes and that support the predictive modeling phase.
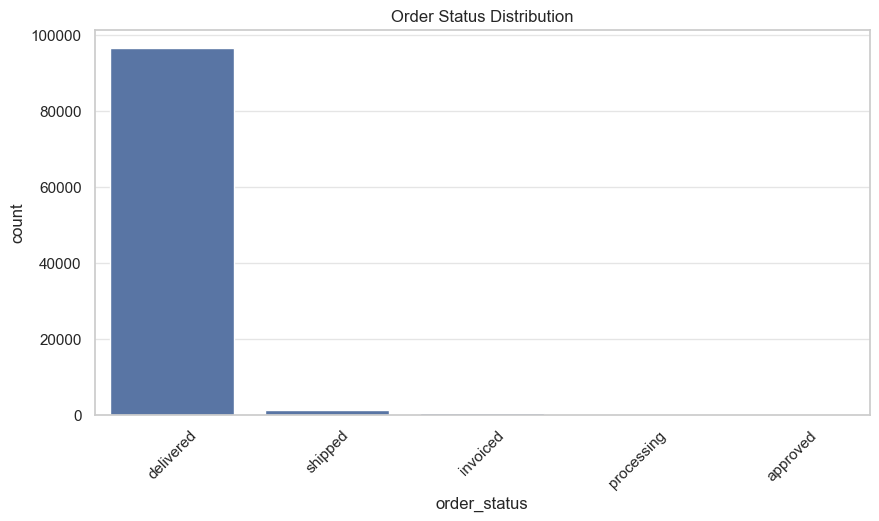
09.1 · Orders
Order status distribution and delivery delay patterns.
The orders dataset was analyzed to understand operational factors that may influence customer review scores. The analysis focused on key delivery‑related variables — order status distribution, delivery time patterns, purchase timestamp trends, delivery delays, and estimated vs. actual delivery comparisons.
 ZOOM
ZOOM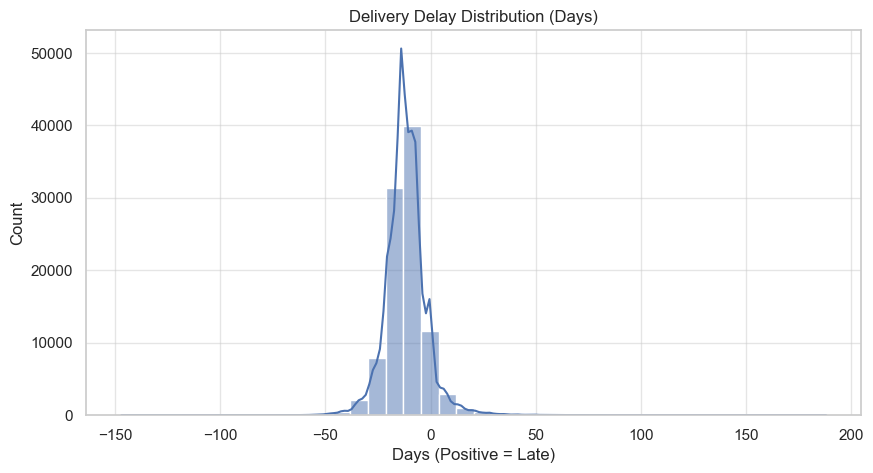 ZOOM
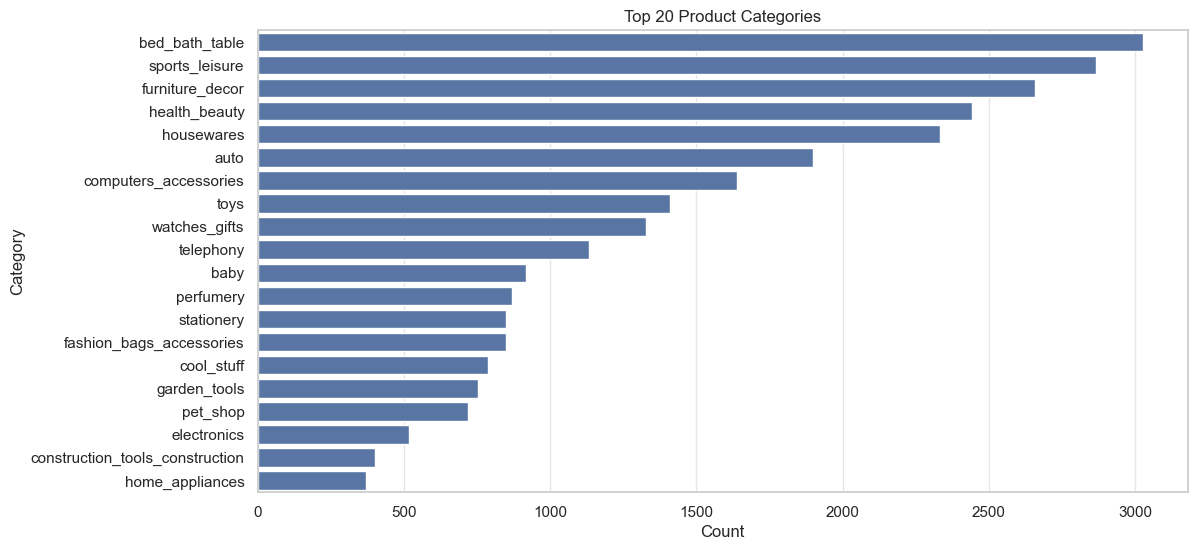
ZOOM09.2 · Products
Product category prevalence and physical attributes.
The products dataset reveals which categories dominate the catalog and how physical product attributes — weight and dimensions — relate to fulfilment experience. Heavier or larger items are more exposed to damage and longer delivery times.
 ZOOM
ZOOM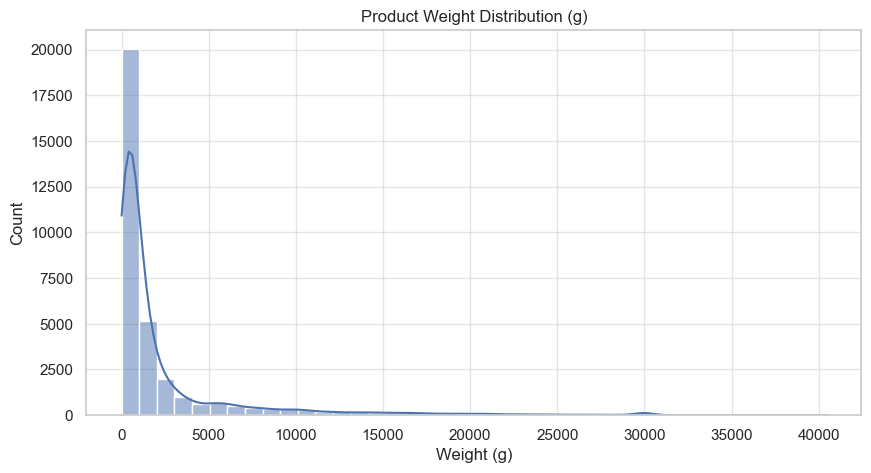 ZOOM
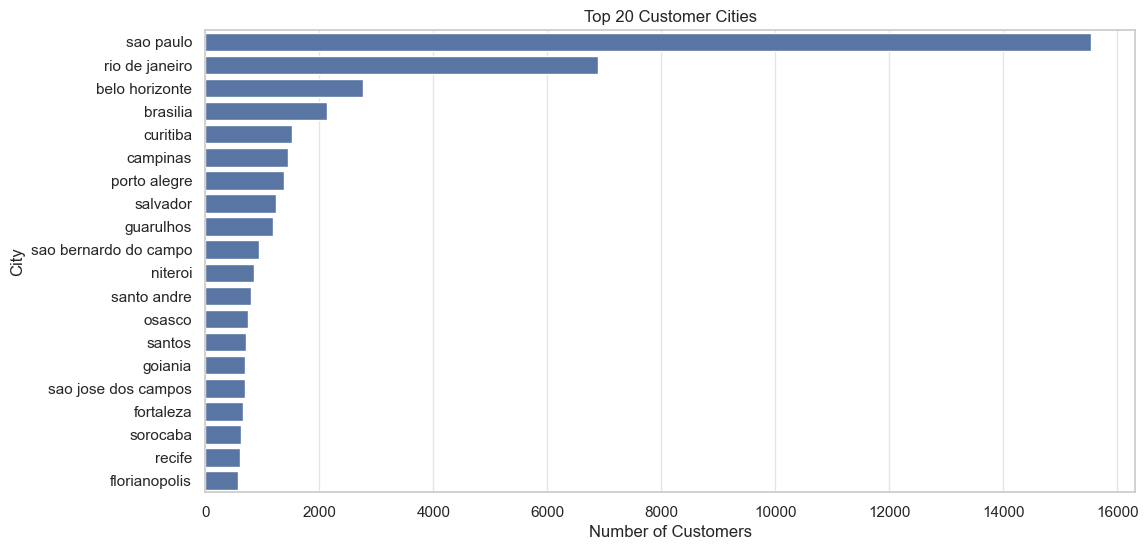
ZOOM09.3 · Customers
Geographic spread across Brazilian states and cities.
Brazil's geographic scale creates significant regional variation in logistics efficiency. Customer concentration in São Paulo, Rio de Janeiro, and Minas Gerais shapes both demand patterns and delivery performance — and indirectly, review outcomes.
 ZOOM
ZOOM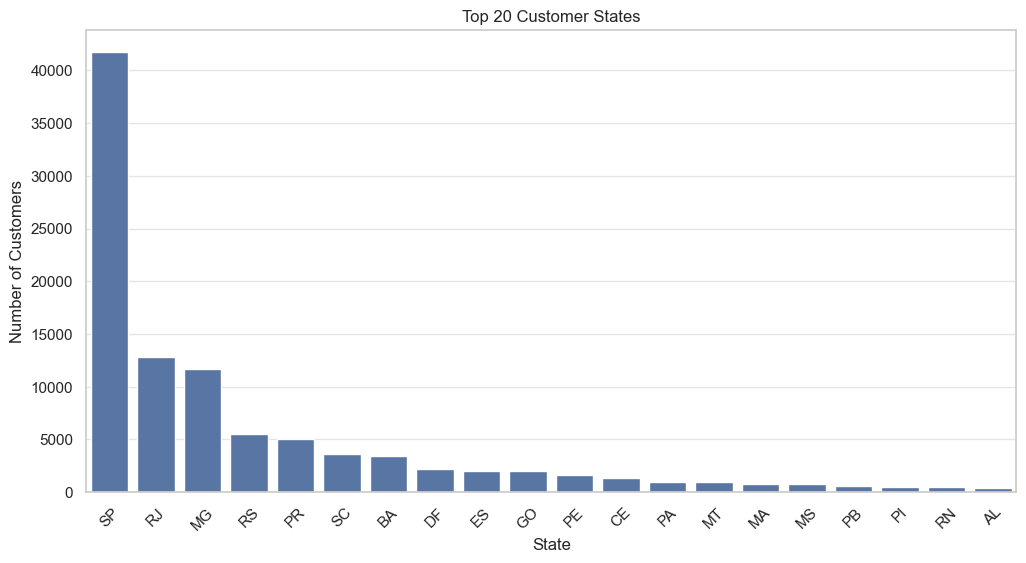 ZOOM
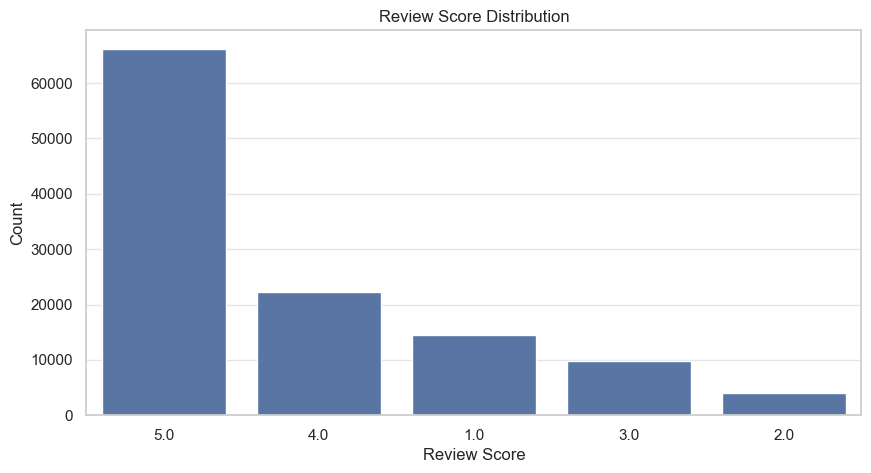
ZOOM09.4 · Combined Dataset
Price, freight, review scores, and pairwise correlations.
The merged master dataset surfaces interactions between operational, product, and customer‑level variables and how they relate to customer review scores — providing direct numerical support for the modeling phase that follows.
 ZOOM
ZOOM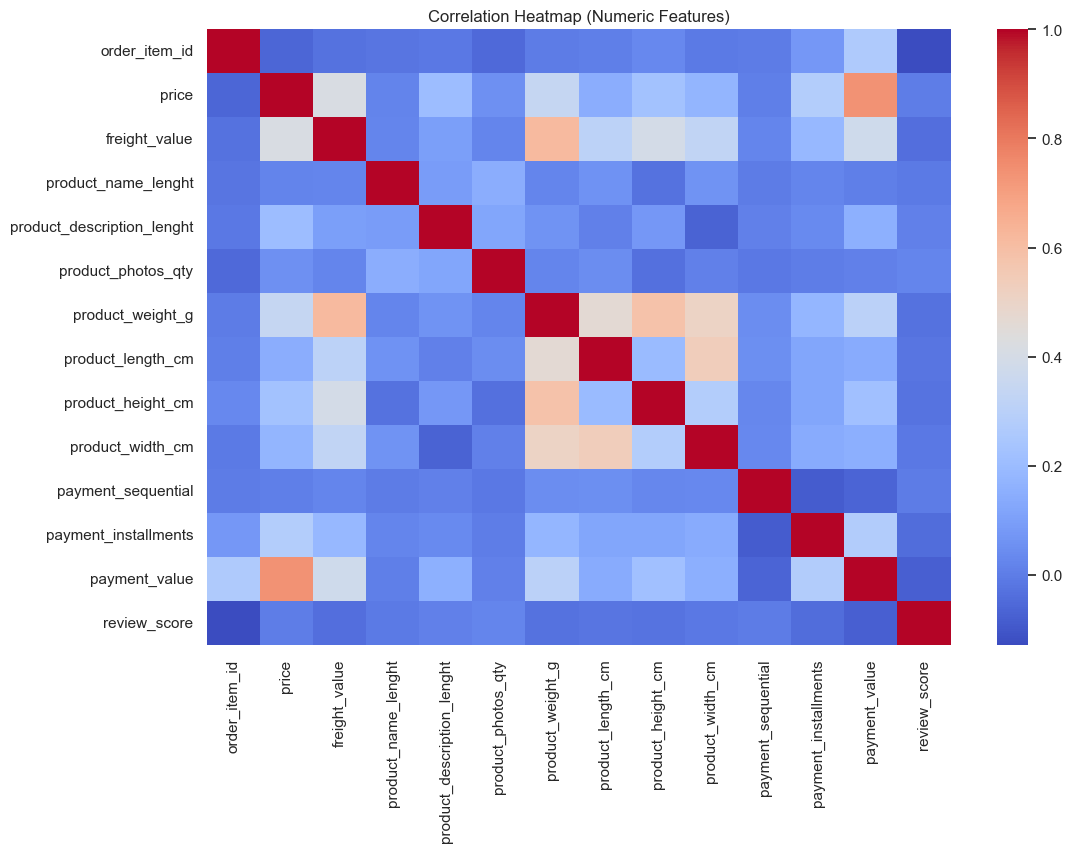 ZOOM
ZOOM09.5 · Descriptive Statistics
Central tendencies and skewness.
- Price and freight value show strong right‑skewed distributions — most orders are low‑cost with a small number of high‑value purchases.
- Product weight and dimensions also exhibit right skewness, consistent with the presence of a few very large or heavy items.
- Delivery delays have a mean close to zero but a wide range — reflecting both early and late deliveries.
- Review scores are heavily concentrated at the high end (4 and 5 stars), confirming class imbalance addressed during modeling.
- Payment values vary widely, with some customers using multiple installments — reflecting purchasing behavior and financial flexibility.