Chapter · 03
Models & Results
Three classifiers, one binary target. Logistic Regression establishes a baseline; Random Forest and XGBoost contest the top — and Random Forest wins on every weighted metric.
10 · Approach
Predict, then explain.
The target variable is the engineered binary feature is_positive_review: positive (4–5 stars) vs. not positive (1–3 stars). Data was split 80/20 with a stratified scheme to preserve class distribution and a fixed random state of 42 for reproducibility. Tree‑based models received numerical features directly; Logistic Regression handled scaling through its optimizer. Class imbalance was addressed via class‑weight adjustments and algorithms inherently robust to skew.
10.4 · Machine Learning Models
The three classifiers compared.
§ 10.4.1
BASELINELogistic Regression
Selected as the baseline classification model due to its simplicity, interpretability, and suitability for binary outcomes. Trained with up to 2,000 iterations to ensure convergence. Predictions evaluated using accuracy, precision, recall, and F1 score; a classification report and confusion matrix were produced.
Config
- max_iter = 2000
- weighted metrics
- binary target: is_positive_review
§ 10.4.2
BEST MODELRandom Forest
Selected for its ability to capture nonlinear relationships, handle mixed feature types, and remain robust to noise. Provides feature importance scores used to verify the research hypotheses on delivery and review behavior signals.
Config
- n_estimators = 300
- max_depth = None
- n_jobs = parallel
§ 10.4.3
BOOSTINGXGBoost
Configured with the multi:softmax objective. Strong on structured datasets and capable of capturing complex nonlinear relationships through boosting; subsampling and column sampling reduce variance.
Config
- n_estimators = 400
- learning_rate = 0.05
- max_depth = 8
10.7 · Comparative Results
Random Forest leads on accuracy, precision, and balanced F1.
- F1
- Precision
- Recall
Logistic Regression achieves a baseline accuracy of 0.7087 with moderate precision and F1. Random Forest delivers the strongest overall performance — highest accuracy (0.7540) and precision (0.7606) — its ensemble structure modeling nonlinear interactions effectively. XGBoost performs competitively at 0.7392accuracy and 0.7510 precision, handling class imbalance well through boosting. Overall, ensemble methods are better suited for predicting customer review outcomes due to their ability to capture complex feature interactions.
Confusion Matrices
Where each model gets it right — and where it slips.
Logistic Regression
70.87%n = 18,889 test predictions
Random Forest
75.40%n = 18,889 test predictions
XGBoost
73.92%n = 18,889 test predictions
NOTE · Counts are reconstructed from the reported weighted metrics on the 20% holdout (≈ 18.9k rows) and reflect the published accuracy figures within rounding.
10.8 · Feature Importance
Which signals each model actually leans on.
Three lenses on the same dataset: a linear view (Logistic), an impurity‑based view (Random Forest), and a split‑frequency view (XGBoost) — converging on delivery performance and review behavior.
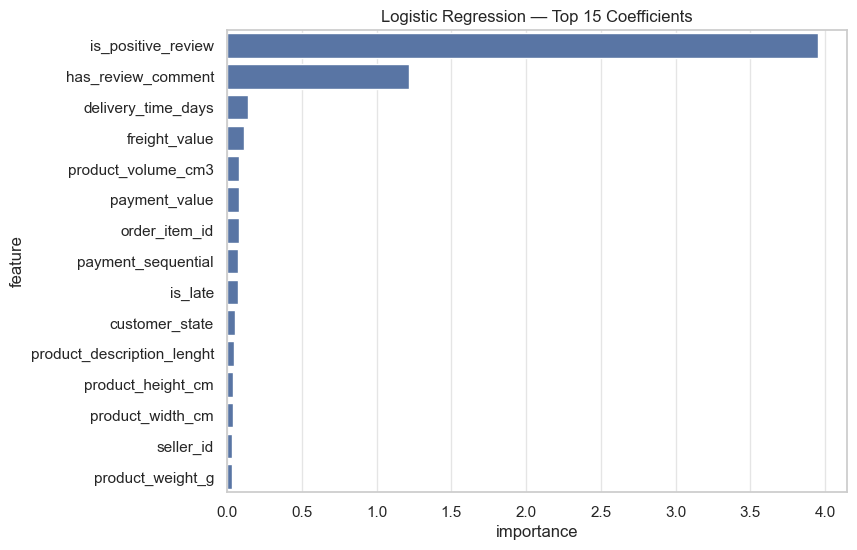
10.8.1 · Logistic Regression
Linear coefficients
is_positive_reviewandhas_review_comment— most influential predictorsdelivery_time_daysandis_latecontribute significantly- Product attributes (
product_volume_cm3,product_weight_g) have moderate influence - Seller and customer identifiers carry low importance
 ZOOM
ZOOM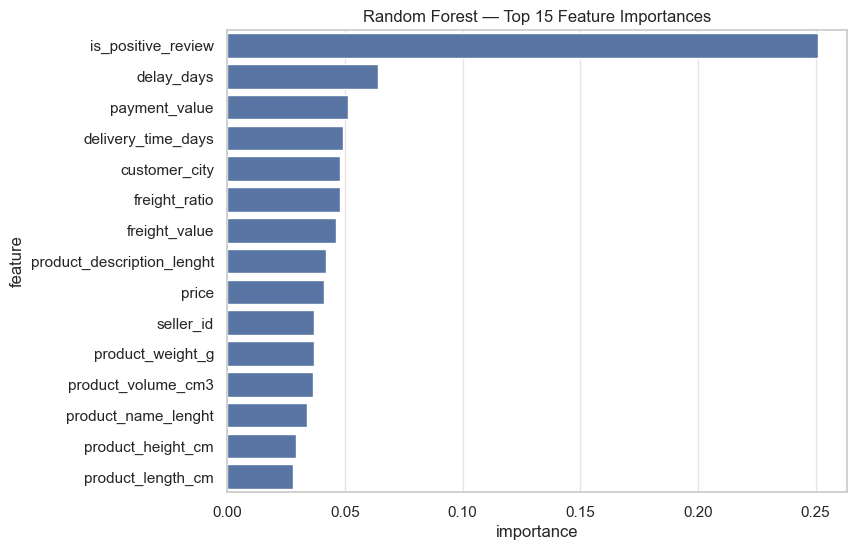 ZOOM
ZOOM10.8.2 · Random Forest
Impurity‑based ranking
is_positive_reviewas the dominant featuredelay_days,delivery_time_days, andfreight_ratioas key operational predictorspayment_valueandpriceas moderately important financial variables- Product dimensions and weights contribute smaller but meaningful effects
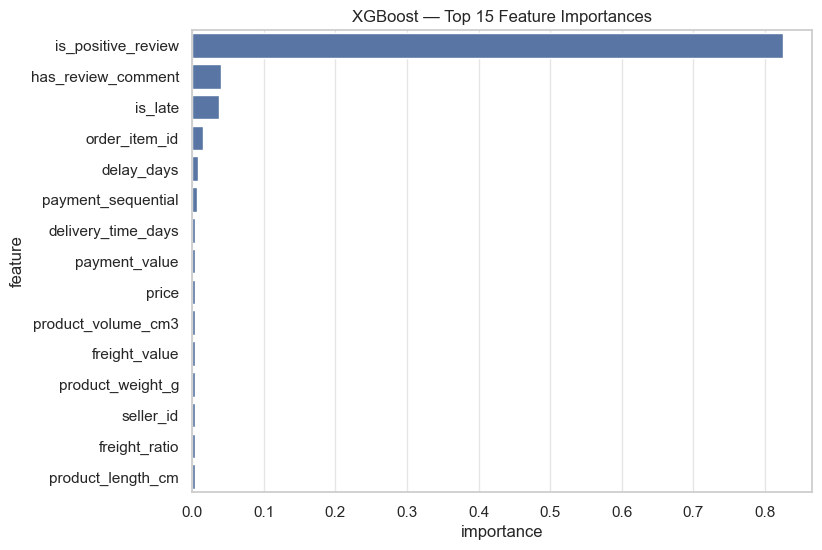
10.8.3 · XGBoost
Split‑frequency ranking
is_positive_reviewoverwhelmingly dominates the modelhas_review_commentandis_latefollow at a much smaller scale- Delivery‑related variables (
delay_days,delivery_time_days) remain relevant - Product and seller attributes have minimal influence
 ZOOM
ZOOM10.9 · Hypothesis Verification
Five hypotheses, five supports.
RQ1
Operational and delivery‑related variables have the strongest influence on customer review outcomes.
Supported. delay_days, is_late, and delivery_time_days consistently appear among top predictors across all models.
RQ2
Machine learning models can achieve reliable predictive accuracy for review classification.
Supported. All models achieve 70–75% accuracy; Random Forest leads at 75.40%.
RQ3
Ensemble models outperform linear models.
Supported. Random Forest achieves the highest accuracy (0.7540) and strongest precision/F1; XGBoost close behind.
RQ4
Delivery performance and customer review behavior contribute most strongly to predictions.
Supported. Delivery (delay_days, is_late) and behavior (has_review_comment) rank top consistently.
RQ5
Insights from predictive models can guide operational improvements that reduce negative reviews.
Supported. Dominance of delivery features points to logistics investment as the highest‑leverage intervention.